Most application security reports to the board open with a count: open vulnerabilities, critical findings, scans run. Counts are easy to produce and almost impossible to interpret. A number that rises when you add a scanner and falls when you switch one off tells a board nothing about whether the organisation is safer than it was last quarter.
In short
- Report risk, not activity. Scans run, findings found and tickets opened measure effort. Boards need to know whether exposure is shrinking.
- Five metrics cover most of what a board needs: exploited-and-reachable exposure, SLA adherence, time to remediate by priority, the opened-versus-fixed trend and coverage.
- Keep operational metrics for the security team. Noise reduction, triage throughput and scanner health matter, but they belong in the weekly review, not the board pack.
- Every metric needs a definition that does not change. If adding a scanner moves the number, the number is measuring the scanner.
Why vulnerability counts mislead
A raw count of open vulnerabilities has three properties that make it a poor board metric. It grows with coverage: connect another hundred repositories and the count goes up, even though you have just reduced the risk of the unknown. It is dominated by noise: the same library reported by three tools counts three times. And it treats a critical in a test fixture as equal to a critical on the payment API.
data
Exploitation of vulnerabilities has grown as an initial way into organisations. Verizon’s Data Breach Investigations Report recorded a sharp rise in vulnerability exploitation as a breach entry point in its 2024 edition, and a further increase in 2025, to roughly a fifth of breaches. Over the same period the CISA Known Exploited Vulnerabilities catalog grew past a thousand entries.
Sources: Verizon DBIR 2024 and 2025; CISA Known Exploited Vulnerabilities catalog. Figures rounded; see the reports for exact definitions.
Boards have absorbed that message. What they now ask is narrower and harder: of the vulnerabilities that attackers actually use, how many do we have, where, and how fast do we close them? A count of everything cannot answer that. A small set of well-defined metrics can.
The number went up 18% this quarter because two acquisitions were onboarded. Nobody in the room can tell whether that is good or bad news.
Coverage grew by two acquisitions, and the exposure that matters still fell. The board can see the trend and ask about the three.
The board set: five metrics
These five metrics are chosen because each answers a question a director will actually ask, each can be defined precisely, and none moves just because you changed tools.
| Metric | Question it answers | Definition | Target direction |
|---|---|---|---|
| 1. Exploited, reachable exposure | Do we have what attackers are using? | Open findings on a CISA KEV-listed vulnerability, on an internet-facing or production asset, not dev-only or test code | Towards zero; any number above zero is named |
| 2. SLA adherence | Do we do what our policy says? | Share of P1 and P2 findings fixed within their SLA (by default 7 and 30 days); plus the count overdue today | Above an agreed floor, e.g. 90% for P1 |
| 3. Time to remediate | How fast do we close real risk? | Median and 90th-percentile time from first seen to fixed, per priority, over the last 90 days | Down, or stable inside SLA |
| 4. Opened versus fixed | Is the backlog growing? | Actionable findings opened and fixed per week; the gap is the backlog’s growth rate | Fixed ≥ opened over a quarter |
| 5. Coverage | What are we not looking at? | Share of repositories, production images and cloud accounts scanned in the last 30 days | Up, towards the whole estate |
Notice that the first metric deliberately excludes most findings. That is the point. It is the number that maps most directly to the question “could we be breached the way companies are being breached right now?”, and it is small enough that the CISO can name every item on it.
after correlation"] B --> C["Actionable
P1 and P2"] C --> D["Known exploited
KEV-listed"] D --> E["Reachable
exposed, production"] E --> F["Board metric 1
named individually"] style F fill:#ccfbf1,stroke:#0d9488
The board metric is the bottom of a funnel the security team works through every week.
Showing each metric
The chart matters as much as the number. A single figure invites the question “compared to what?”. A trend answers it. The opened-versus-fixed chart is the most useful single picture for a board: when the fixed line sits above the opened line, the backlog is shrinking.
Illustrative. Bars are findings opened; the line is findings fixed. From April the line is above the bars and the backlog shrinks.
Time to remediate is best shown per priority, as a median with the 90th percentile beside it. Medians hide the long tail; the 90th percentile shows the findings that sat for months. If the P1 median is four days and the P1 90th percentile is sixty, the board should hear about the sixty.
The operational set: for the security team, not the board
A second group of metrics runs the programme week to week. They are vital, and they are the wrong thing to put in front of directors because they describe the machinery rather than the outcome.
| Metric | Why the team needs it | Why the board does not |
|---|---|---|
| Noise reduction (raw → unique → actionable) | Shows whether correlation and context are working, and how much developer time is being saved | It is an efficiency measure; impressive, but not a risk measure |
| Triage throughput and age of untriaged findings | Spots a backlog building in the security team itself | Internal capacity, handled inside the function |
| Dismissal and snooze rates by team | A team dismissing most of its findings is either very well configured or hiding work | Needs context to read; easily misinterpreted |
| Scanner health and scan failures | A silent scanner looks like a clean result | Covered at board level by the coverage metric |
| Time to remediate by team | Shows which teams need help, tooling or a security champion | Useful as an escalation, not as a standing league table |
Our own measured funnel
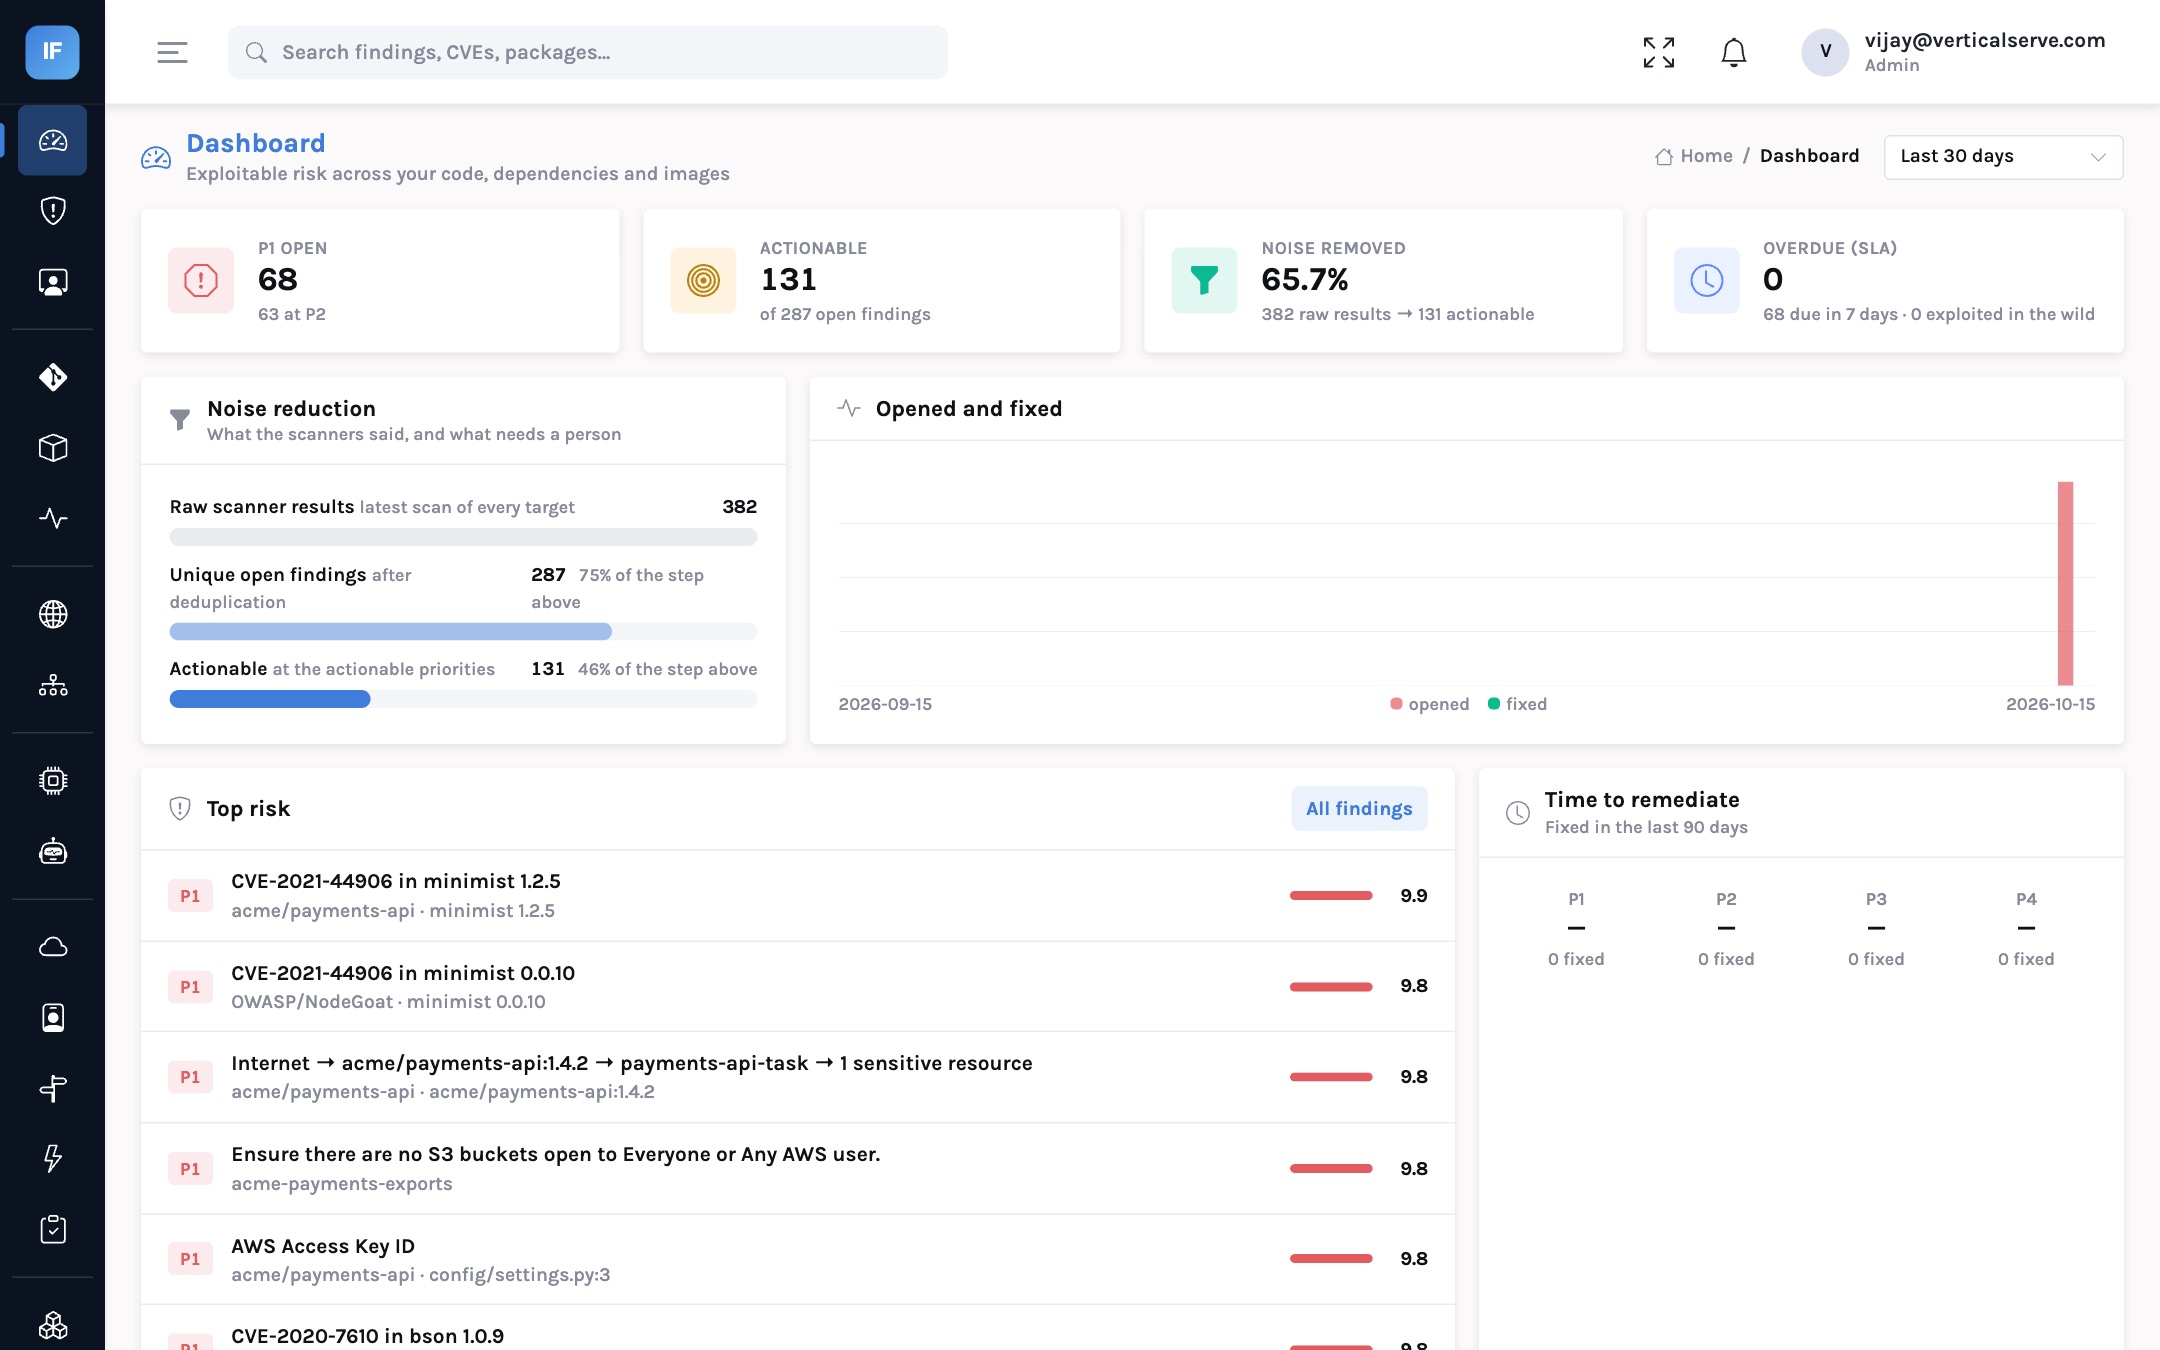
On our demo estate (two sample services, OWASP NodeGoat, a ZAP scan of OWASP Juice Shop and one AWS account) 382 raw scanner results correlated to 287 unique findings and 131 actionable ones, a 66% reduction. That number tells the security team the tooling is doing its job. It is not what the board should be told about risk.
Metrics that look good while risk goes up
Every metric can be gamed, usually without anyone meaning to. These are the patterns to watch for.
- Falling counts from narrower scanning. If coverage drops, every other number improves. Always show coverage next to the risk metrics.
- Improving SLA adherence through dismissals. A finding dismissed as “won’t fix” leaves the SLA calculation. Track the dismissal rate, and require a reason for every one.
- Snoozes that never end. A snooze should expire. If the same finding is snoozed quarter after quarter, it is an unrecorded risk acceptance.
- Re-scoring to meet a target. If priority weights change, say so, and restate the prior quarter on the new basis so the trend is honest.
- Mean instead of median. One finding fixed in a minute and one left for a year average to six months. Report medians and 90th percentiles.
Metrics with a stable definition that describe risk go to the board. Activity metrics stay with the team.
Producing the numbers each quarter
Confirm the five definitions have not changed. If they have, restate last quarter on the new basis.
Known-exploited reachable exposure, SLA adherence, time to remediate, opened versus fixed, from the dashboard and the findings API.
Repositories, images and cloud accounts scanned in the last 30 days, against the asset inventory. Name any gaps.
For every finding in metric 1: the system, the owner, the plan and the date. Directors will ask.
Sample the quarter’s dismissals for quality. Long-running snoozes become formal risk acceptances or get fixed.
Three sentences: what changed, why, and what you need from the board, if anything.
InsightFortify keeps the inputs in one place: the dashboard and its API provide the funnel, open findings by priority, SLA overdue and due soon, known-exploited findings open, time to remediate by priority and by team, and the opened-versus-fixed trend. It does not yet export a formatted board report; most teams paste the charts into their existing board template.
What each audience takes away
For the CISO
Five numbers with fixed definitions let you tell the same story every quarter, and make it obvious when something has changed.
Metric 1 is small enough to own personally. Know every item on it.
For the AppSec lead
The operational set is how you run the programme. Watch dismissal rates and the 90th-percentile time to remediate; they are where trouble starts.
Coverage is your defence against a misleadingly clean report.
For the board
Ask for the trend, not the count. Ask what is on the known-exploited list and when it will be gone.
A rising count after an acquisition can be good news. A rising exploited-exposure number never is.
Boards do not need to know how many vulnerabilities you have. They need to know how many of the ones attackers use are still open, and for how long.
Report five metrics with stable definitions. Keep the machinery metrics for the team.