For fifteen years the application security answer to every new risk has been another scanner. Static analysis, then dependency scanning, then containers, then infrastructure as code, then secrets, then cloud posture, then APIs. Each one was a sensible purchase. Together they produced something nobody designed: a backlog of tens of thousands of findings, a developer population that has learned to ignore it, and a board question — “are we safer than last year?” — that most security leaders cannot answer with evidence.
In short
- The volume problem is structural, not a staffing gap. Published vulnerabilities, scanner categories and code output have all grown faster than any security team can.
- More scanners made the signal worse, not better. Each tool reports the same issue in its own words, so duplicates and noise grow with coverage.
- Activity metrics hide risk. “Findings opened” and “scans run” go up every quarter whether or not exposure goes down.
- The fix is a layer, not another tool. Correlate everything, add the context scanners cannot see, and measure the short list that is actually exploitable.
Three curves that crossed
Application security did not get worse at its job. Three things it depends on grew at different rates, and the gap between them is now wider than any hiring plan can close.
1. The number of known vulnerabilities
The public vulnerability record has grown almost every year for a decade. In 2024 the CVE programme published roughly 40,000 new entries, the highest annual total on record, and the National Vulnerability Database spent much of the year with a backlog of entries waiting for analysis. Every one of those CVEs is a potential line in a dependency or container scan.
2. The amount of software
Modern applications are mostly assembled, not written. A typical service pulls in hundreds of open-source packages, directly and transitively, ships in a container image with its own operating-system packages, and is deployed by infrastructure code that is itself software. AI coding assistants have accelerated the rate at which new code, and new dependencies, arrive.
3. The size of the security team
Application security teams are small relative to the engineering organisations they serve. Ratios of one AppSec engineer to a hundred or more developers are commonly reported in industry surveys, and the global shortage of security staff has been documented every year by ISC2’s workforce study. Security headcount grows linearly at best. The other two curves do not.
data
Roughly 40,000 CVEs were published in 2024. Verizon’s Data Breach Investigations Report found that exploitation of vulnerabilities as an initial access route almost tripled in its 2024 edition, and the 2025 edition put it at about one breach in five. IBM’s 2024 Cost of a Data Breach study put the global average cost of a breach at USD 4.88 million.
Sources: CVE Program / NVD publication statistics (2024); Verizon DBIR 2024 and 2025; IBM Security, Cost of a Data Breach Report 2024; ISC2 Cybersecurity Workforce Study.
How the scanner estate grew
Each wave of tooling answered a real gap. The issue is what happens when they all report into different places, in different formats, with their own idea of severity.
Every addition was justified. Few estates ever removed one.
Talk to security leaders at mid-size and large organisations and the same picture recurs: eight to fifteen tools that produce findings, two or three consoles that nobody outside the security team opens, and a spreadsheet or ticket export that is the real system of record. The same vulnerable library appears in the dependency scanner, the container scanner and the SBOM tool — three findings, three tickets, one fix.
one library upgrade"] T2 --> D T3 --> D style D fill:#fef3c7,stroke:#b45309
Illustrative: the same CVE in one package, reported three times.
Why more coverage produced less signal
It is tempting to read the backlog as proof that the organisation is insecure. Usually it is proof of something narrower: the findings have not been joined up. Four mechanisms account for most of the noise.
| Mechanism | What it looks like | Why it matters to leadership |
|---|---|---|
| Duplication | The same issue from several tools, branches and rescans | Inflates every count you report and spends developer goodwill |
| No exploitability signal | Sorted by CVSS, where more than half of CVEs are High or Critical | The “critical” list is too long to finish, so nothing gets finished |
| No environment context | Test code, dev-only packages and internal services ranked like production | Remediation capacity goes to things attackers cannot reach |
| No ownership | Findings attached to a scanner, not a team or a service | Nobody is accountable, so SLAs are aspirational |
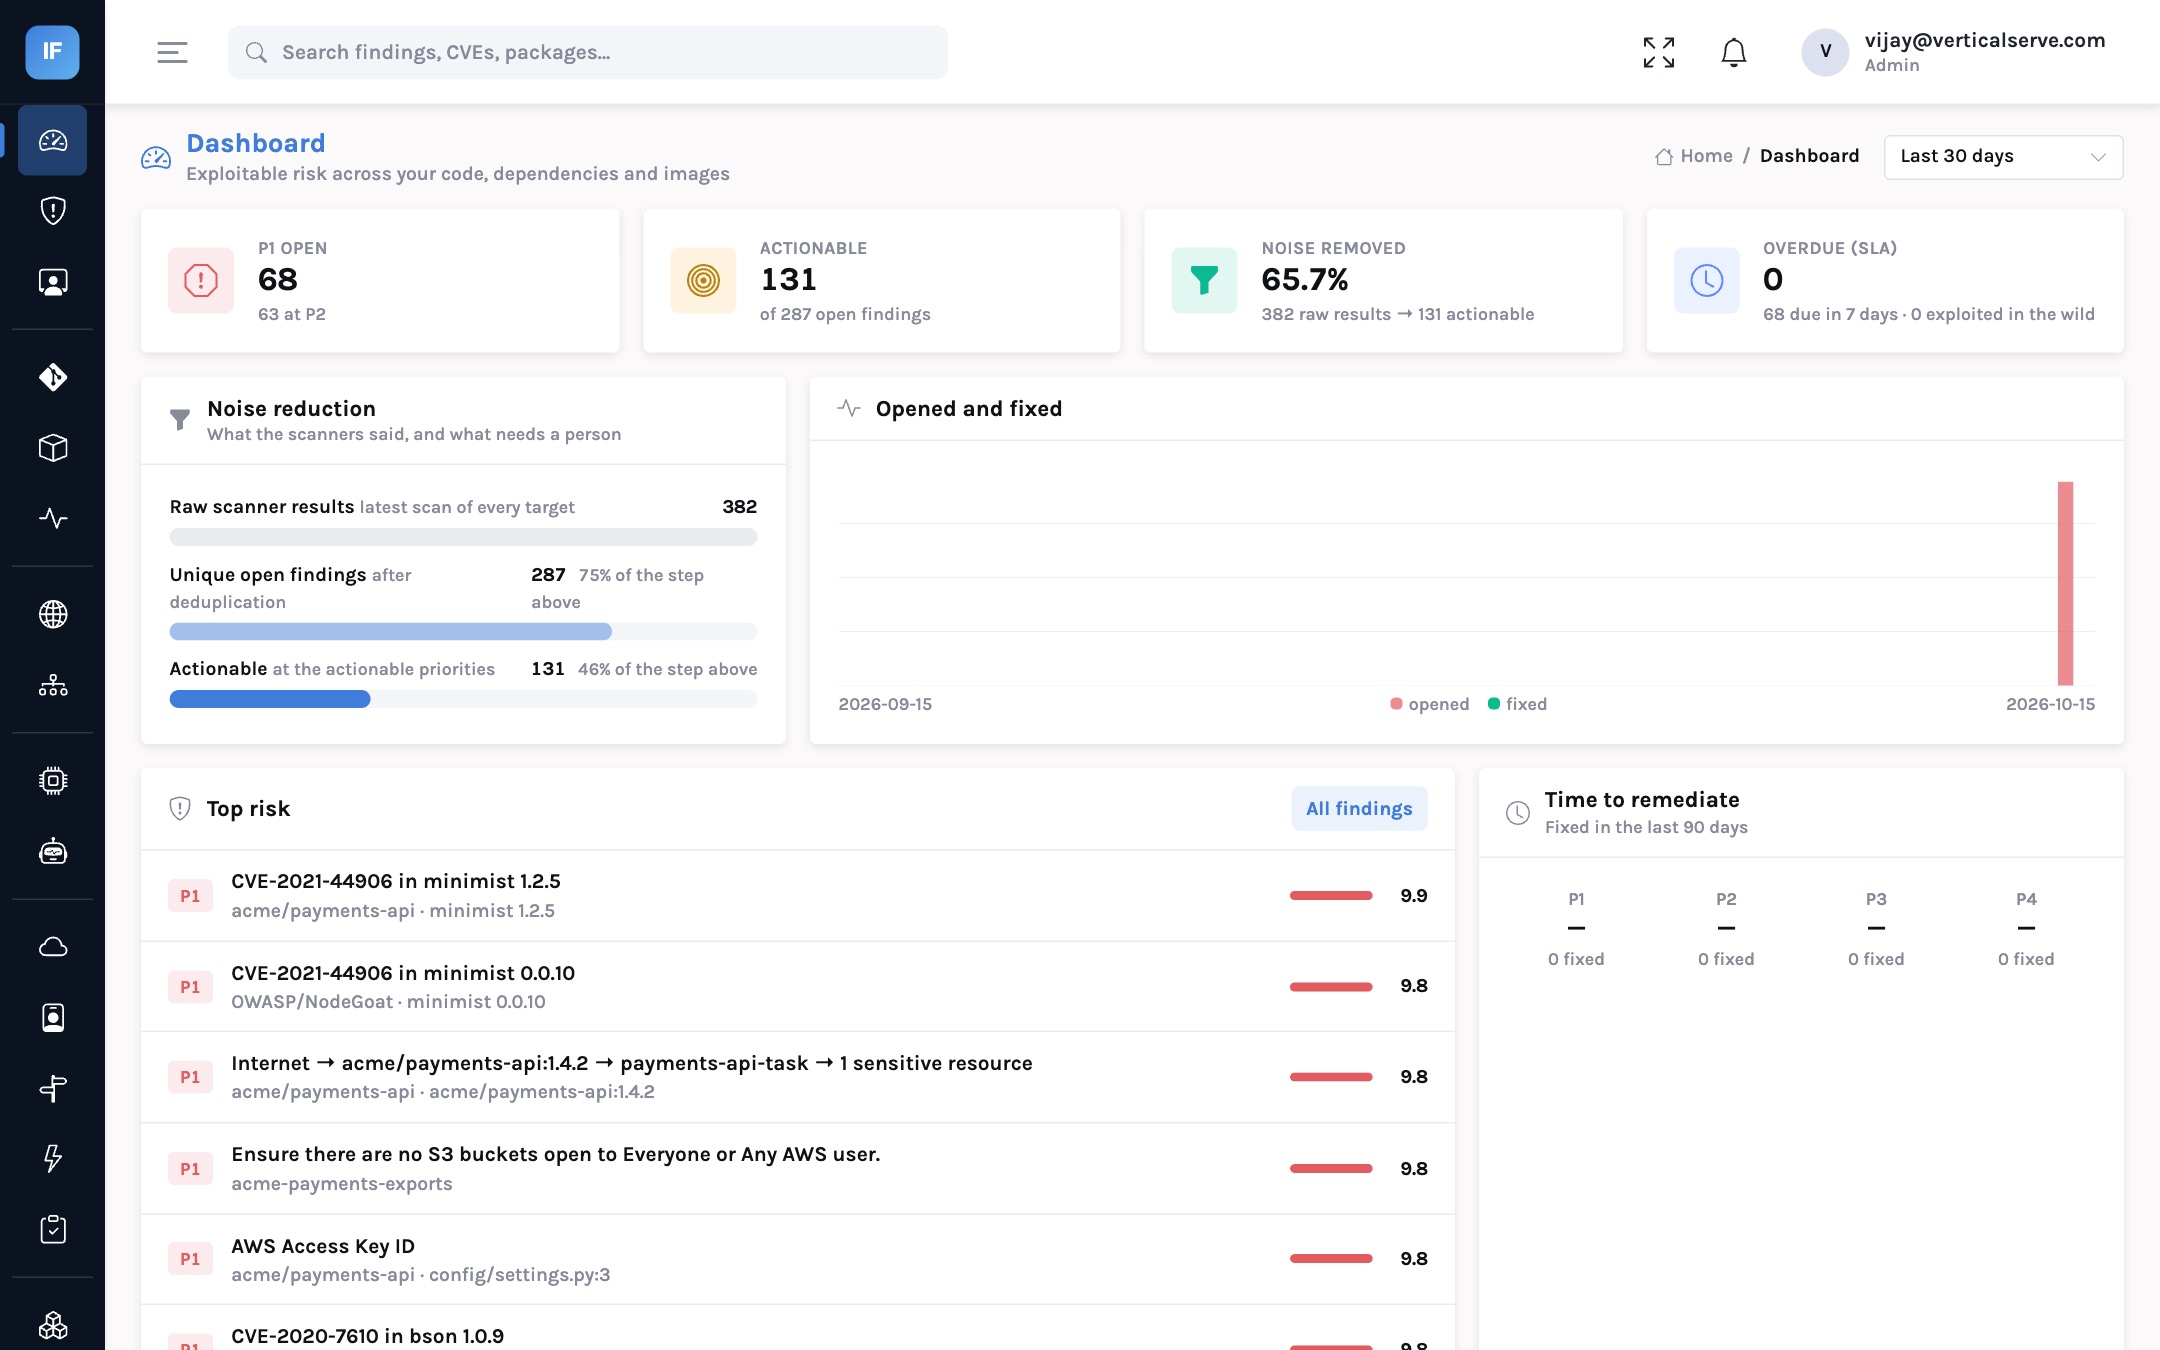
Our own measurements make the scale concrete. On the demo estate we use for this site — two sample services, OWASP NodeGoat, a dynamic scan of OWASP Juice Shop and one AWS account — the scanners produced 382 raw results. Correlation reduced that to 287 unique findings. Adding exploitation data and environment context left 131 that we would ask a developer to act on.
A note on these numbers
These come from scans we ran ourselves on public, deliberately vulnerable applications plus our own sample services. Real estates differ in mix and size. In our experience the shape, a large duplicate share and a minority that is genuinely actionable, is what tends to repeat.
The measurement trap
When the list is unmanageable, programmes drift towards measuring what they can count. Scans run, findings opened, tickets created, training completed. Every one of these goes up and to the right, which looks like progress in a quarterly review and says nothing about exposure.
Open critical vulnerabilities: 4,212. Scans this quarter: 18,900. Repositories covered: 92%. The numbers grow with coverage, so they can never show improvement.
Known-exploited, reachable findings past SLA: 6, down from 41. Median time to fix P1: 5 days. These can fall to zero, and a board can understand why they moved.
The second set requires something the first does not: a defensible definition of which findings matter. That is the gap the market now calls application security posture management — a layer that sits above the scanners rather than replacing them.
What a scaling programme looks like
Programmes that have broken out of the volume trap tend to share the same structure. None of the steps is novel on its own. The difference is doing them in one place, for every kind of finding.
code, cloud, runtime, AI"] --> C["Normalise and correlate
one issue = one finding"] C --> X["Add context
KEV, EPSS, exposure, data"] X --> P["Prioritise
P1-P4 with an SLA"] P --> M["Owner fixes it
MTTR and SLA measured"] style P fill:#ccfbf1,stroke:#0d9488
Deduplicate across tools, branches and rescans so every metric starts from unique findings.
CISA KEV and FIRST EPSS on every vulnerability; refresh it continuously, not quarterly.
Internet exposure, data classes, criticality and compensating controls, set on the repository or cloud resource and inherited.
Write down what P1 means and how fast it is fixed. Make it short enough to be achievable.
Board reporting moves to exploitable exposure, SLA position and time to remediate.
What the volume trap costs
The cost of noise is rarely put in a budget, because it is spread across hundreds of engineers in small amounts. It is worth estimating anyway, because it is usually the largest single cost of an application security programme and the one that tooling choices affect most.
| Illustrative assumption | Value | Note |
|---|---|---|
| Developers receiving security findings | 400 | A mid-size engineering organisation |
| Findings routed to each developer per month | 6 | Before correlation and context |
| Minutes to read, investigate and respond to one | 30 | Including the ones that turn out not to matter |
| Share that are duplicates or not reachable | about two-thirds | In line with the funnel measured above |
| Developer hours a month on findings that did not need action | ~800 | 400 × 6 × 0.5 h × 2/3 |
Eight hundred hours a month is roughly five full-time engineers spent on work that reduced no risk. The arithmetic is illustrative and your inputs will differ, but the structure is general: noise costs scale with the number of developers, not the number of security staff, which is why it is invisible in the security budget and very visible in engineering’s.
There is a second cost that is harder to count. Every irrelevant finding teaches developers that the next one is probably irrelevant too. When a real, exploited vulnerability arrives, it lands in a channel people have learned to skim.
Signs a programme is in the volume trap
- The headline metric only goes up. Open vulnerabilities, findings raised or scans run are reported as progress.
- Nobody can say how many findings are unique. Counts are summed across tools.
- “Critical” means CVSS 9 or above. Exploitation and exposure are not part of the definition.
- The SLA is breached by design. The number of P1s exceeds what the organisation could fix in the stated time even if it did nothing else.
- Exceptions live in email. Accepted risks have no owner, no reason on record and no expiry.
- Developers ask security which findings to ignore. The tool has lost authority, and the AppSec team has become the filter by hand.
Two or more of these usually means the next investment should be in correlation and prioritisation rather than in additional detection.
What it means at each level
For the CISO
Stop buying coverage to solve a prioritisation problem. The next tool will add findings, not clarity.
Ask for one number you can defend in front of the board and an auditor: exploitable exposure past SLA.
For the AppSec lead
Your scanners are probably fine. The work is correlation, context and an agreed policy, done once and applied to everything.
Measure your own raw-to-actionable funnel; it is the best argument you will have with engineering.
For the board
A growing vulnerability count is not, by itself, evidence of growing risk. Ask how many are known to be exploited and reachable.
Ask how long the most serious ones stay open, and whether that number is improving.
Application security did not stop scaling because teams got worse. It stopped scaling because nobody joined the tools up.
Correlate, add the context, agree what matters and measure that. The scanners can stay.